p5js_workshop
6 hours workshop about p5.js and p5play.js
Probabilmente incontrerete un sacco di typos e errori, aiutatemi a rendere il materiale del workshop più bello con ISSUES e PRGiorno 1 - Parte 2 - primitive grafiche
il sistema di coordinate
Prima di tutto dobbiamo fare due parole su come funziona il sistema di coordinate dentro il canvas (e in generale dentro quasi tutti gli schermi)
Teniamo presente che le coordinate sull’asse Y crescono verso il basso!
Le primitive grafiche
Linea line(x1,y1,x2,y2)
line(30, 20, 85, 75);
Parameters
- x1 Number: the x-coordinate of the first point
- y1 Number: the y-coordinate of the first point
- x2 Number: the x-coordinate of the second point
- y2 Number: the y-coordinate of the second point
Rettangolo rect(x1,y1,w,h)
rect(30, 20, 55, 55);
Parameters
- x Number: x-coordinate of the ellipse.
- y Number: y-coordinate of the ellipse.
- w Number: width of the ellipse.
- h Number: height of the ellipse.
Ellisse rect(x1,y1,w,h)
rect(30, 20, 55, 55);
Parameters
- x1 Number: the x-coordinate of the first point
- y1 Number: the y-coordinate of the first point
- w Number: width of the rectangle.
- h Number: height of the rectangle.
le proprietà grafiche
il colore di riempimento fill(r,g,b), nofill();
fill(200,200,200);
Parameters
- r Number: value of red
- g Number: value of green
- b Number: value of blue
Il contorno stroke(r,g,b), nostroke(), strokeWeight(x);
stroke(255, 204, 0);
strokeWeight(4);
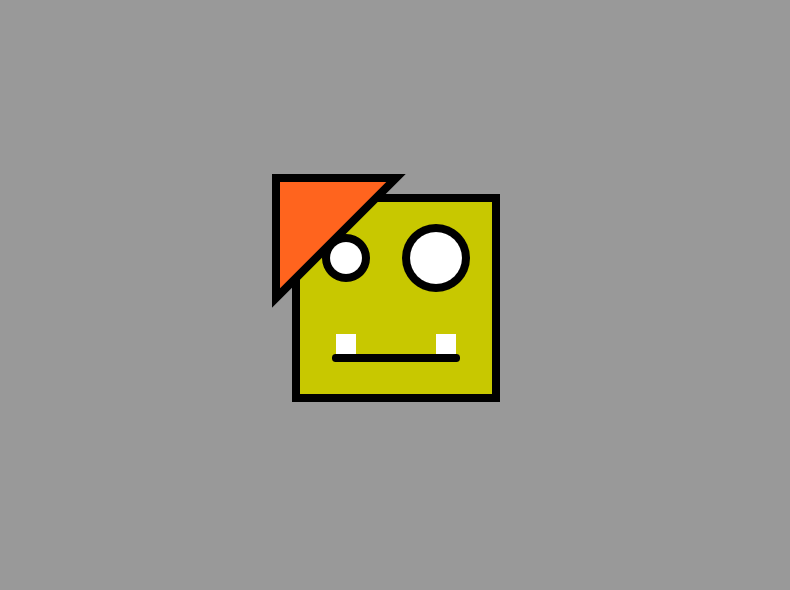
disegniamo qualcosa di “bello”
function setup() {
  createCanvas(400, 300);
  background(153);

  strokeWeight(4);

  fill(200,200,0);
  rect(width/2-50, height/2-50, 100, 100);

  fill (255);
  ellipse(width/2-50+25, height/2-50+30, 20, 20)
  ellipse(width/2-50+70, height/2-50+30, 30, 30)

  stroke(0);
  line(width/2-30, height/2+30, width/2+30, height/2+30)

  noStroke();
  rect(width/2-30, height/2+18, 10, 10);
  rect(width/2+20, height/2+18, 10, 10);

  push();
  stroke(0);
  translate(width/2-60,height/2-60);
  fill(255,100,30);
  triangle(0, 0, 0, 60, 60, 0);
  pop();
}

function draw() {
}
matrici di trasformazione push() pop();
oltre alle primitive grafiche nel codice sopra abbiamo anche usato le funzioni pop(), push(), e translate(x,y). Queste ci permettono di cambiare il sistema di coordinate. Quindi ogni cosa disegnata in coordinata (0,0) all’interno una volta chiamata la funziona push() verrà disegnata all’origine del nuovo sistema di coordinate. Nel nostro caso la funzione translate trasla il sistema di coordinate in (width/2-60,height/2-60).
push();
stroke(0);
translate(width/2-60,height/2-60);
fill(255,100,30);
triangle(0, 0, 0, 60, 60, 0);
pop();